
UPTIME_ANALYZE
UPTIME_ANALYZE
Batch Data Analytics Module
UPTIME_ANALYZE is a data-at-rest analytics engine driven by the need to leverage manufacturers’ legacy data and operational data related to maintenance, and to extract and correlate relevant knowledge. It is mainly addressed to manufacturers’ maintenance teams, including maintenance managers and factory workers, who need to gain insights on what happened in the past (for historical data) and what is happening at the moment or the near past/future (for operational data).
MOTIVATION
• Only 20-30% of the value from the available data-at-rest is currently accrued by manufacturers
• Legacy and operational data analysis has the credentials to provide an all-around view of the maintenance activities in the shopfloor
• Legacy and operational data analysis can help a manufacturer address the cold-start problem for real-time sensor data processing
• Manufacturers cannot afford to miss out on the unexplored potential of the legacy and operational data
KEY ADVANTAGES OF UPTIME_ANALYZE :
• Extract & correlate relevant knowledge from legacy & operational data
• Address the cold start problem with some initial predictions for predictive maintenance even when adequate sensor data are not yet available
• Facilitate interfacing with 3rd party systems already deployed in a manufacturing site in order to obtain additional maintenance-related data
ANALYSIS OF LEGACY AND OPERATIONAL DATA
UPTIME_ANALYZE is mainly addressed to manufacturers’ maintenance team, including maintenance managers and factory workers, who need to gain insights on what happened in the past (for historical data) and what is happening at the moment or the near past/future (for operational data). UPTIME_ANALYZE provides such business users with intuitive and user-friendly (not requiring any technical background) interfaces in order to support them in uploading the relevant data and extracting the implicit knowledge that is related to predictive maintenance.
UPTIME_ANALYZE can be also used by data analysts to further experiment with the incorporated algorithms or to provide additional variations of machine learning algorithms that can derive informed answers to specific, additional questions related to predictive maintenance. Finally, UPTIME_ANALYZE is designed taking into account the overall UPTIME platform picture and is intended to interact with other components, particularly UPTIME_DETECT and UPTIME_PREDICT, as well as UPTIME_DECIDE and UPTIME_FMECA, in order to offer them the legacy and operational data analytics outcomes.
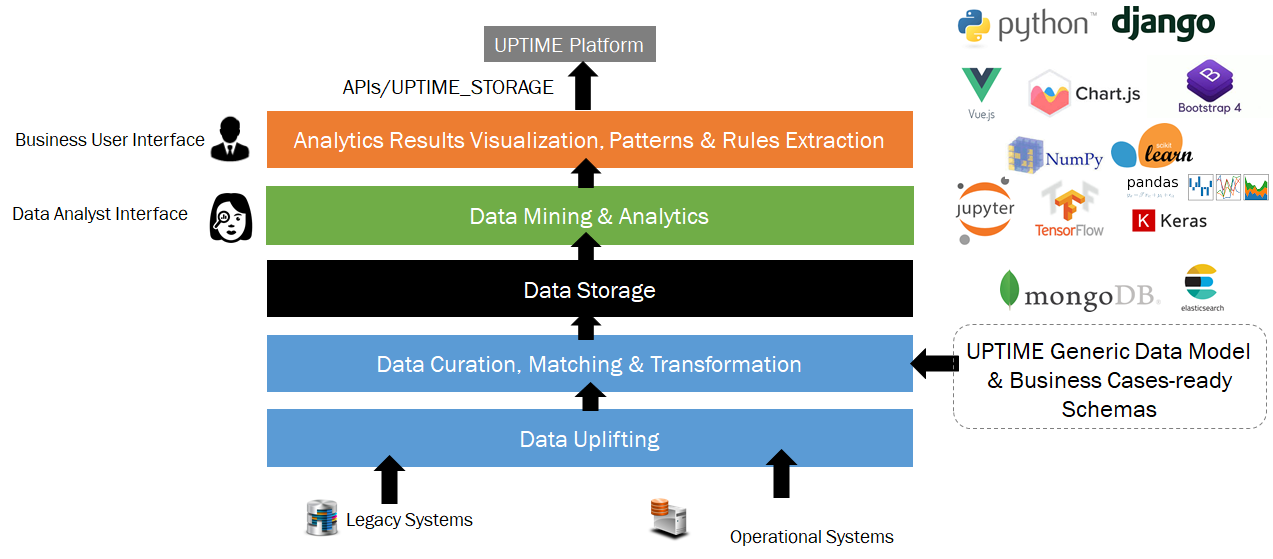
UPTIME_ANALYZE WORKFLOW
UPTIME_ANALYZE allows a manufacturer to upload different datasets that have been extracted from the legacy and operational systems (Data Uplifting Layer). In order to ensure that the datasets provided fall within the scope of predictive maintenance, they are mapped at a semantic and syntactic level to the UPTIME Predictive Maintenance Data Model in a semi-automatic manner (Data Curation, Matching and Transformation Layer).
The data as well as the mapping created are stored, allowing the dataset’s transitioning to the “pre-processed” status (Data Storage Layer). Afterwards, two parallel processes start in the Data Mining & Analytics Layer, which practically delivers the intelligence of the UPTIME_ANALYZE component by defining, training, executing and experimenting with different machine learning algorithms.
– The data analyst has the dataset at his/her disposal and may experiment with the different machine learning algorithms already provided in UPTIME_ANALYZE in the dedicated Data Analyst Interface (e.g. LSTM (Long Short Term Memory) neural network for Time Series Prediction, Kohonen’s Self-Organizing Maps (SOMs) for Dimensionality Reduction, SVM and Random Forest for Classification).
– With the help of intuitive and interactive visualizations in the Business User Interface, the business user can obtain a quick understanding of the uplifted data.
(1) The data analyst has the dataset and may experiment with the different machine learning algorithms already provided in UPTIME_ANALYZE in the dedicated Data Analyst Interface.
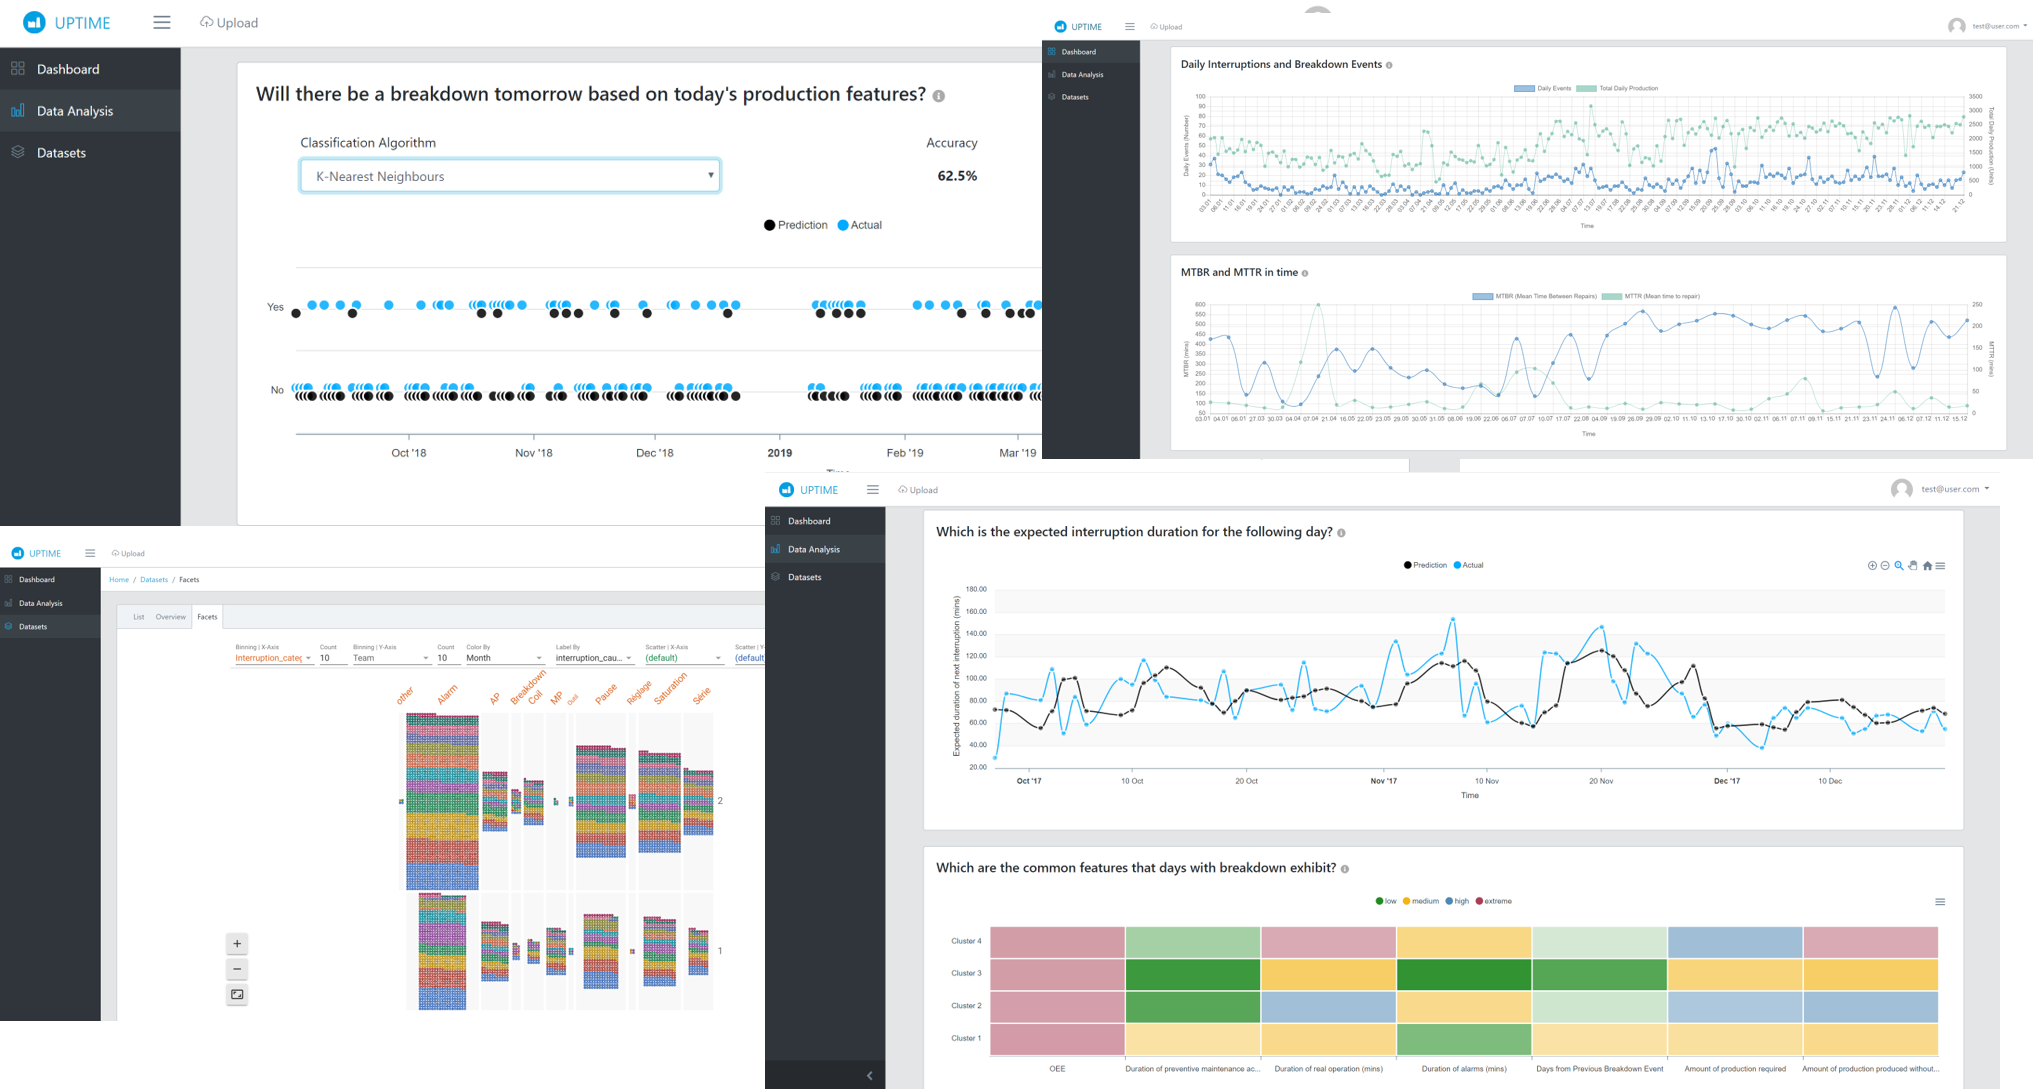
(2) Through the Business User Interface of UPTIME_ANALYZE, the business user can obtain a quick understanding of the data uplifted, including:
a) the distribution of the values across the fields of the dataset
b) the relationships detected within the data provided through interactive exploration of different data facets across multiple dimensions, and
c) the outcomes of the more “statistic” analysis that is automatically computed, e.g. timelines of the interruptions vis-à-vis the failures, the actual versus the planned downtime per day, and the different types of interruption per machine.
As soon as the analysis performed on the dataset by the data analyst concludes, in the Analytics Results Visualization, Patterns and Rules Extraction Layer, the results are appropriately communicated from the Data Analyst Interface to the Business User Interface. In this way, the business users shall have at their disposal and may also navigate to the outcomes of the machine learning analysis in an intuitive manner in their own interface, as depicted below.
UPTIME Other Modules :
UPTIME_SENSE serves as modular data acquisition and manipulation components of the UPTIME Platform. The SENSE component captures data from a high variety of sources and cloud environments. It can connect to both analogue and digital data sources via numerous protocols, acquire data from these heterogeneous data sources, and integrate them towards a configurable data set. It is also capable of storing and intelligently handling and filtering the data acquired and can provide it to other subsequent UPTIME components in the form of sensor data streams for further analysis and processing. Moreover, it brings configurable diagnosis capabilities on the Edge, e.g. for real-time or off-the-grid applications.
UPTIME_DETECT aims to identify the topical state/condition of technical equipment by continuously observing sensor data streams. UPTIME_PREDICT includes abnormal behaviour of technical equipment and accordingly the classification of the condition state (simple example could be traffic light indication such as green, yellow red state). This is done by the possibility to orchestrate so‐called calculation flows based on diagnosis and prediction algorithms that are already built in the algorithmic framework of the tool or that are built on purpose by implementing a simple programming interface.
UPTIME FMECA, Failure Modes Effects and Criticality Analysis, aims to assess failure impacts of a system components. The FMECA component starts from the identification of the failure modes (i.e. how something can break down or fail) associated to each system’s component of an equipment and analyse the impact of such failures on the whole system according to its physical and logical design.
On the basis of (near) real-time predictions about future failures that lay outside the “normal states space”, DECIDE is enacted online in order to generate proactive action recommendations, i.e. recommendations about optimal (perfect or imperfect) maintenance actions and the optimal times of proactive action implementation. To do this, it estimates when the Expected Maintenance Loss will be minimized.
UPTIME_VISUALIZE provides configurable visualization to save time analysing data and getting insights, to support decision making and develop new solutions.
SCIENTIFIC PUBLICATIONS:
-
Predictive Maintenance in a Digital Factory Shop-Floor: Data Mining on Historical and Operational Data Coming from Manufacturers’ Information Systems
Pertselakis M., Lampathaki F., Petrali P. (2019).. In: Proper H., Stirna J. (eds) Advanced Information Systems Engineering Workshops. CAiSE 2019. Lecture Notes in Business Information Processing, vol 349. Springer, Cham